Here are a couple of pie charts that support the audience feedback I received. The first one was ' What was your favourite part of the film'. I gave a selection of things which allows me to see what they actually liked. It shows that the flashbacks were a huge hit with the audience which is fantastic because they are the shots that worried us the most because we didn't know if they would grasp the fact that they are flashbacks from the past.

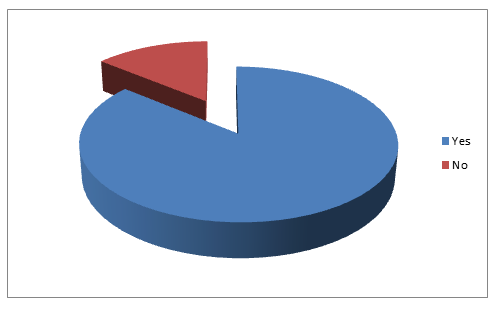
This response is to the age question. It shows that out of 100, the majority were females. Im not sure if this is because of the people I asked but it shows that more females would watch this film. Im not sure if I should be pleased with this result because I expected it to be a more male dominated audience but this proves that I shouldn't expect and conform to the stereotypical views of who sees what film since society is constantly evolving opinions and ideals change regularly.

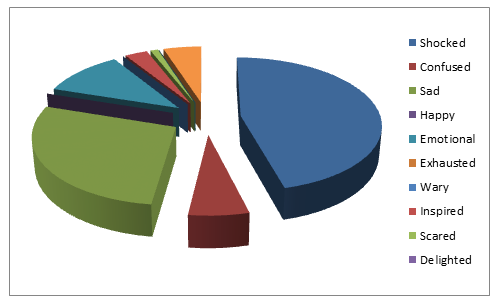
This is the response to how did they feel when watching the film. I am overall pleased with this because it shows that they were shocked and responded well to our expectations of the film.
This is the rating of the film. Because it stays in the top end of the scale it shows that it was a popular film and I'm glad that the 100 people who watched it enjoyed it.

No comments:
Post a Comment